Some leaders use fairy tales to frame their communication if they want to engage and entertain their employees. This article is a folkloric gathering of fairy tales, enriched by Big Data.
“Once upon a time, in a far far land, a poor peasant was in the tooth doctor hut – the blame was on the tobacco in snake oil which gave him a rotten stump. Helped by a mouth speculum, the tooth doctor pulled the stump to prevent decay from spreading to the other teeth. The scream of agony could be heard all the way to the neighbor village, where yet another peasant found himself in a similar situation. With every soul added in heaven, the tooth doctors were learning how to be better doctors, until retirement, when new inexperienced doctors will take their place and gain their knowledge from trials on more poor souls.
Fortunately, today, Big Data changes the way we share and utilize knowledge. Hospitals and medical research centers share their data with all the “villages” and doctors, in order to learn from their experience and nobody needs to die in the name of science.
 Data changes our fairy tales – Think of how Hansel and Gretel could’ve checked Trip Advisor and the bad recommendations would’ve kept them away from the witches’ candy hut.”
These are the stories that Søren Pind – the Minister of Higher Education and Science in Denmark opened his presentation with, at the “Join the Data-Driven R(e)volution – Unlocking the Business Potential of Big Data” conference. Needless to say, the audience was engaged and amused.
His body language, voice, breathing, and pace contributed to the quality of his presentation and storytelling, but an advantage that digital leaders have is that they can focus only on the words they write.
The advantages of using storytelling
Stories are part of one’s upbringing, regardless of their interest in technology – or particularly Big Data in this case – thus, by using stories, leaders can create a bridge in communication and rapport with everyone. In this context, research has shown that a more authentic communication (openly sharing feelings and opinions) might make leaders feel more vulnerable, but that it is the vulnerability that makes employees feel more connected (Richter and Wagner 2014).
Using stories also makes it easier for people to remember a difficult concept, if that concept is drawn as a parallel to something already known.
Examples
Here are some more ready-made stories that you can adapt or be inspired by, based on industry and message, to assemble an engaging text. In a previous blog post, I have provided you with tools on how to assemble multiple types of text – in this blog post, we focus on Story Line and Anecdotes.
The stories below have an educative purpose as well, and that is to provide an overview of industries and businesses that were revolutionized by Big Data, all wrapped up in fairy tales.
E-commerce and market intelligence
Do you remember how The Snow White opened the door to the evil Step Mother and bought the poisonous apple that was recommended to her? Today, a product recommender system could’ve also predicted that she likes apples, based on her previous purchases, and the reviews would’ve kept her away from the poisonous recommendation of the evil Step Mother. (Chen et al., 2012, Adomavicius and Tuzhilin, 2005).
Package Delivery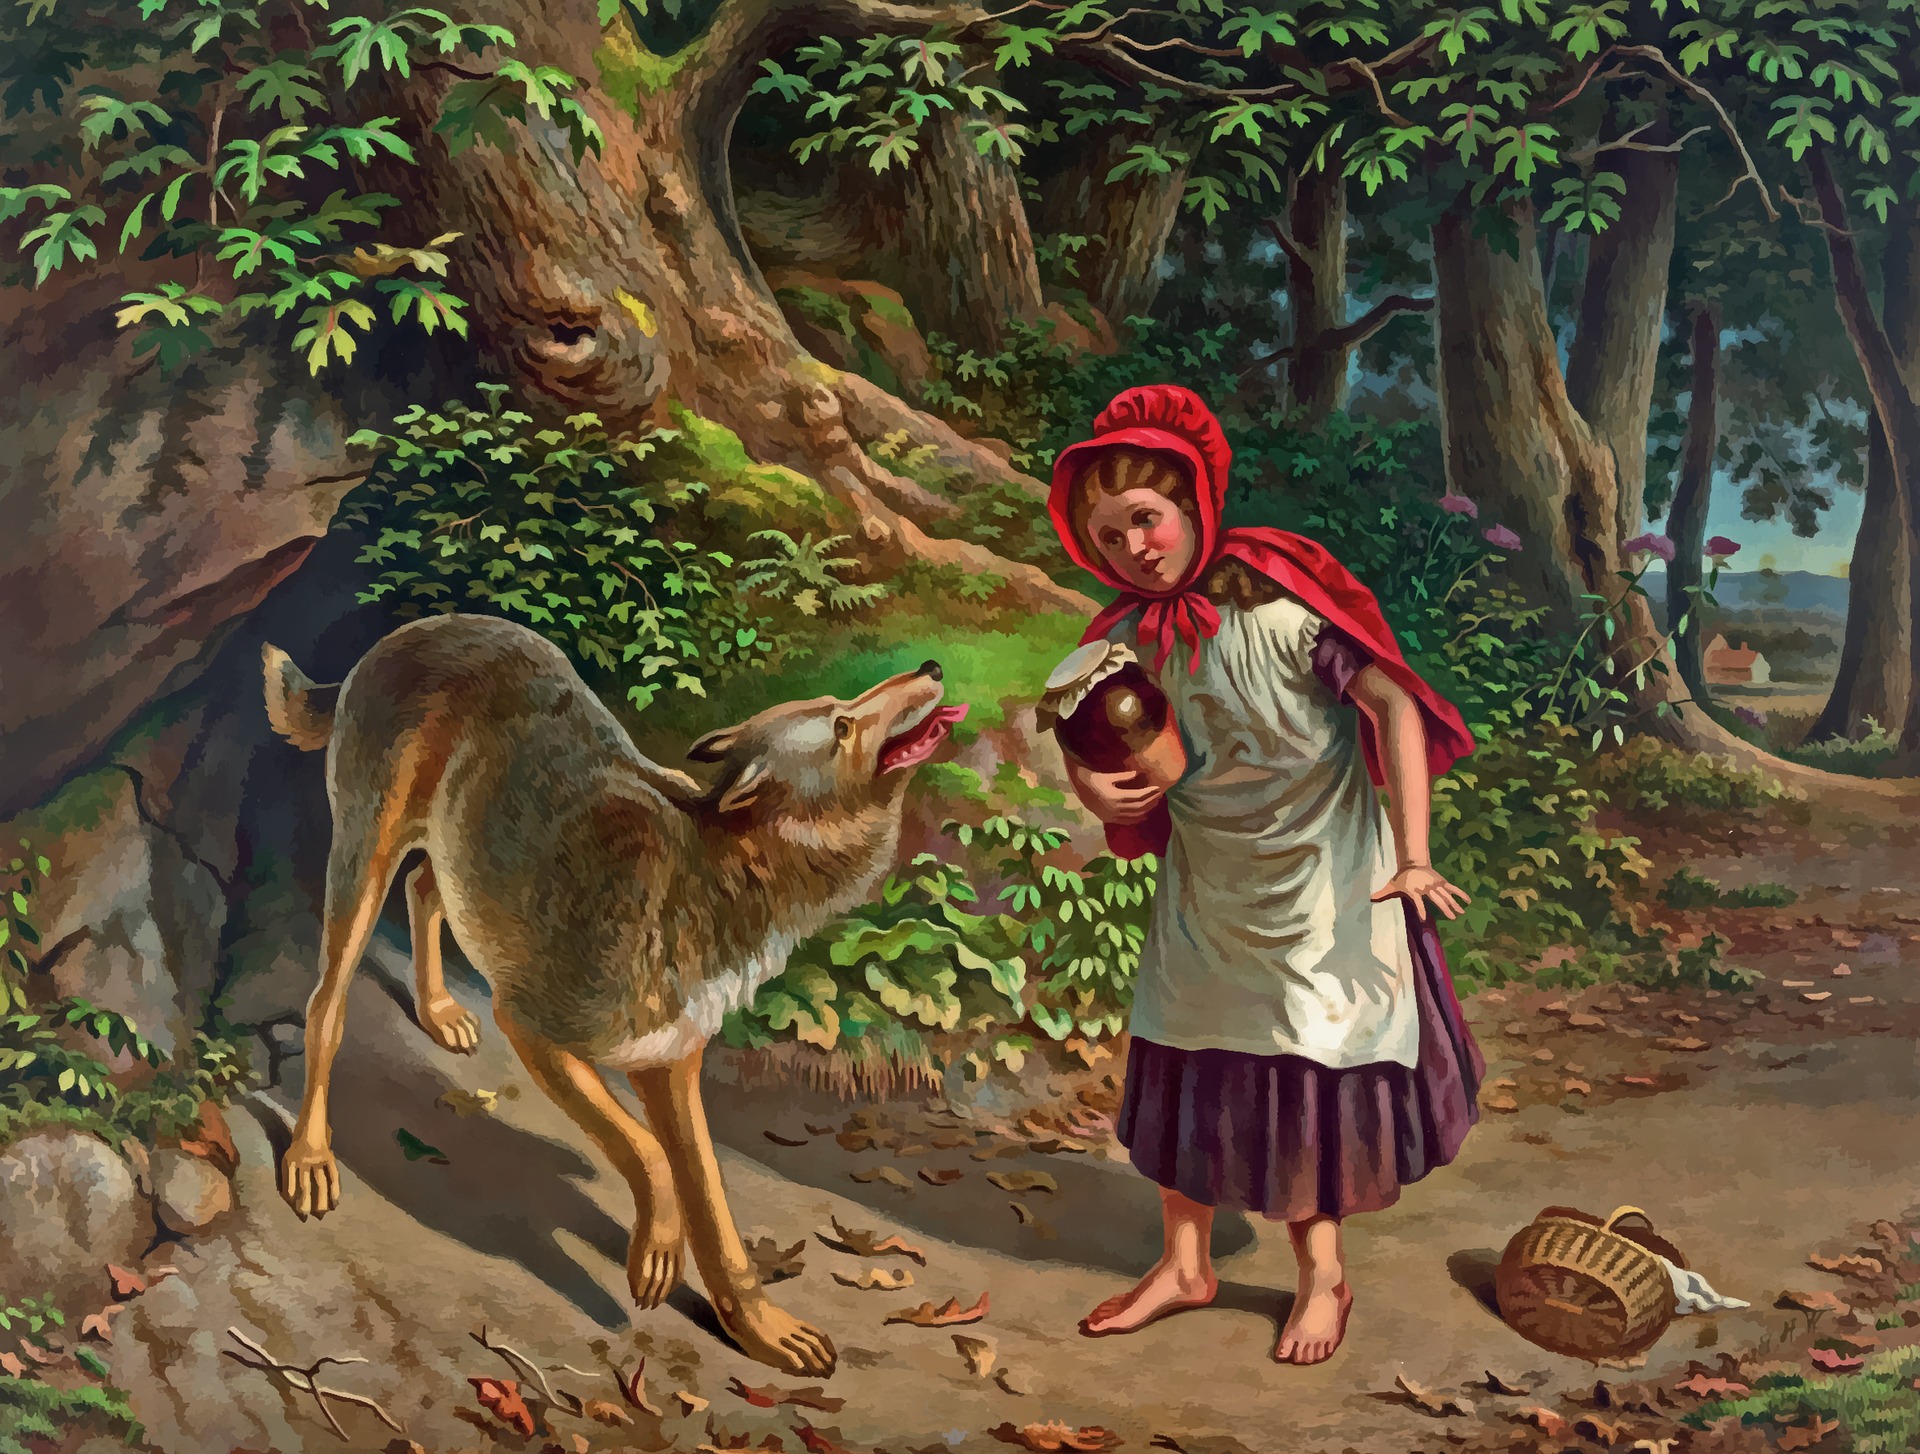
The Little Red Riding Hood could’ve used UPS’ advanced package delivery system to deliver food to grandma. UPS is only one of the package delivery companies revolutionized by the use of Big Data. They are very well known for their use of statistics to anticipate the movement of the package, identify sources of problems (such as the Bad Wolf) and optimize delivery times. (Davenport, 2006).
Security and Public Safety
The 40 thieves from “Alibaba and the 40 Thieves” would’ve been discovered earlier with Big Data. Today, agencies appointed to secure public safety and security are able to gather and combine data from multiple sources, such as criminal records, cyber security threats, and multi-lingual intelligence. Crime and terrorism can be fought by applying models such as criminal network analysis, criminal association rule mining and clustering or cyber-attack analysis. (Chen et al., 2012)
Science and Technology
Once upon a time, Jack was surprised by the magic bean that grew into a Beanstalk all the way to the clouds – but with precision farming, we could’ve measured the right amount of magic spices and we would now all have magic beans that could grow to the clouds.
There are many scientific areas that benefit from the usage of Big Data and tracking of sensors and instruments, such as astrophysics, oceanography, genomics, environment research. To support the transparency and sharing of research, organizations such as the National Science Foundation (NSF) mandate that the investigation projects need to provide data management plans. As an example, in biology, NSF founded iPlant, which enables biologists to track plant biology, learn, share and take decisions. (Chen et al., 2012). Would we all live on our Beanstalks today?
Image recognition and Deep Learning
I would imagine that the vane and mean stepsisters from Cinderella, would’ve posted a lot of selfies on Facebook, and there is also a high probability that Cinderella would’ve been captured in the pictures, sweeping the chimney in the background. With face recognition and deep learning, the Prince would’ve been able to find her faster. Today, the advancement in deep learning allow computers to recognize patterns and identify the objects or faces in unlabelled images. (Singh, 2017)
People matching algorithms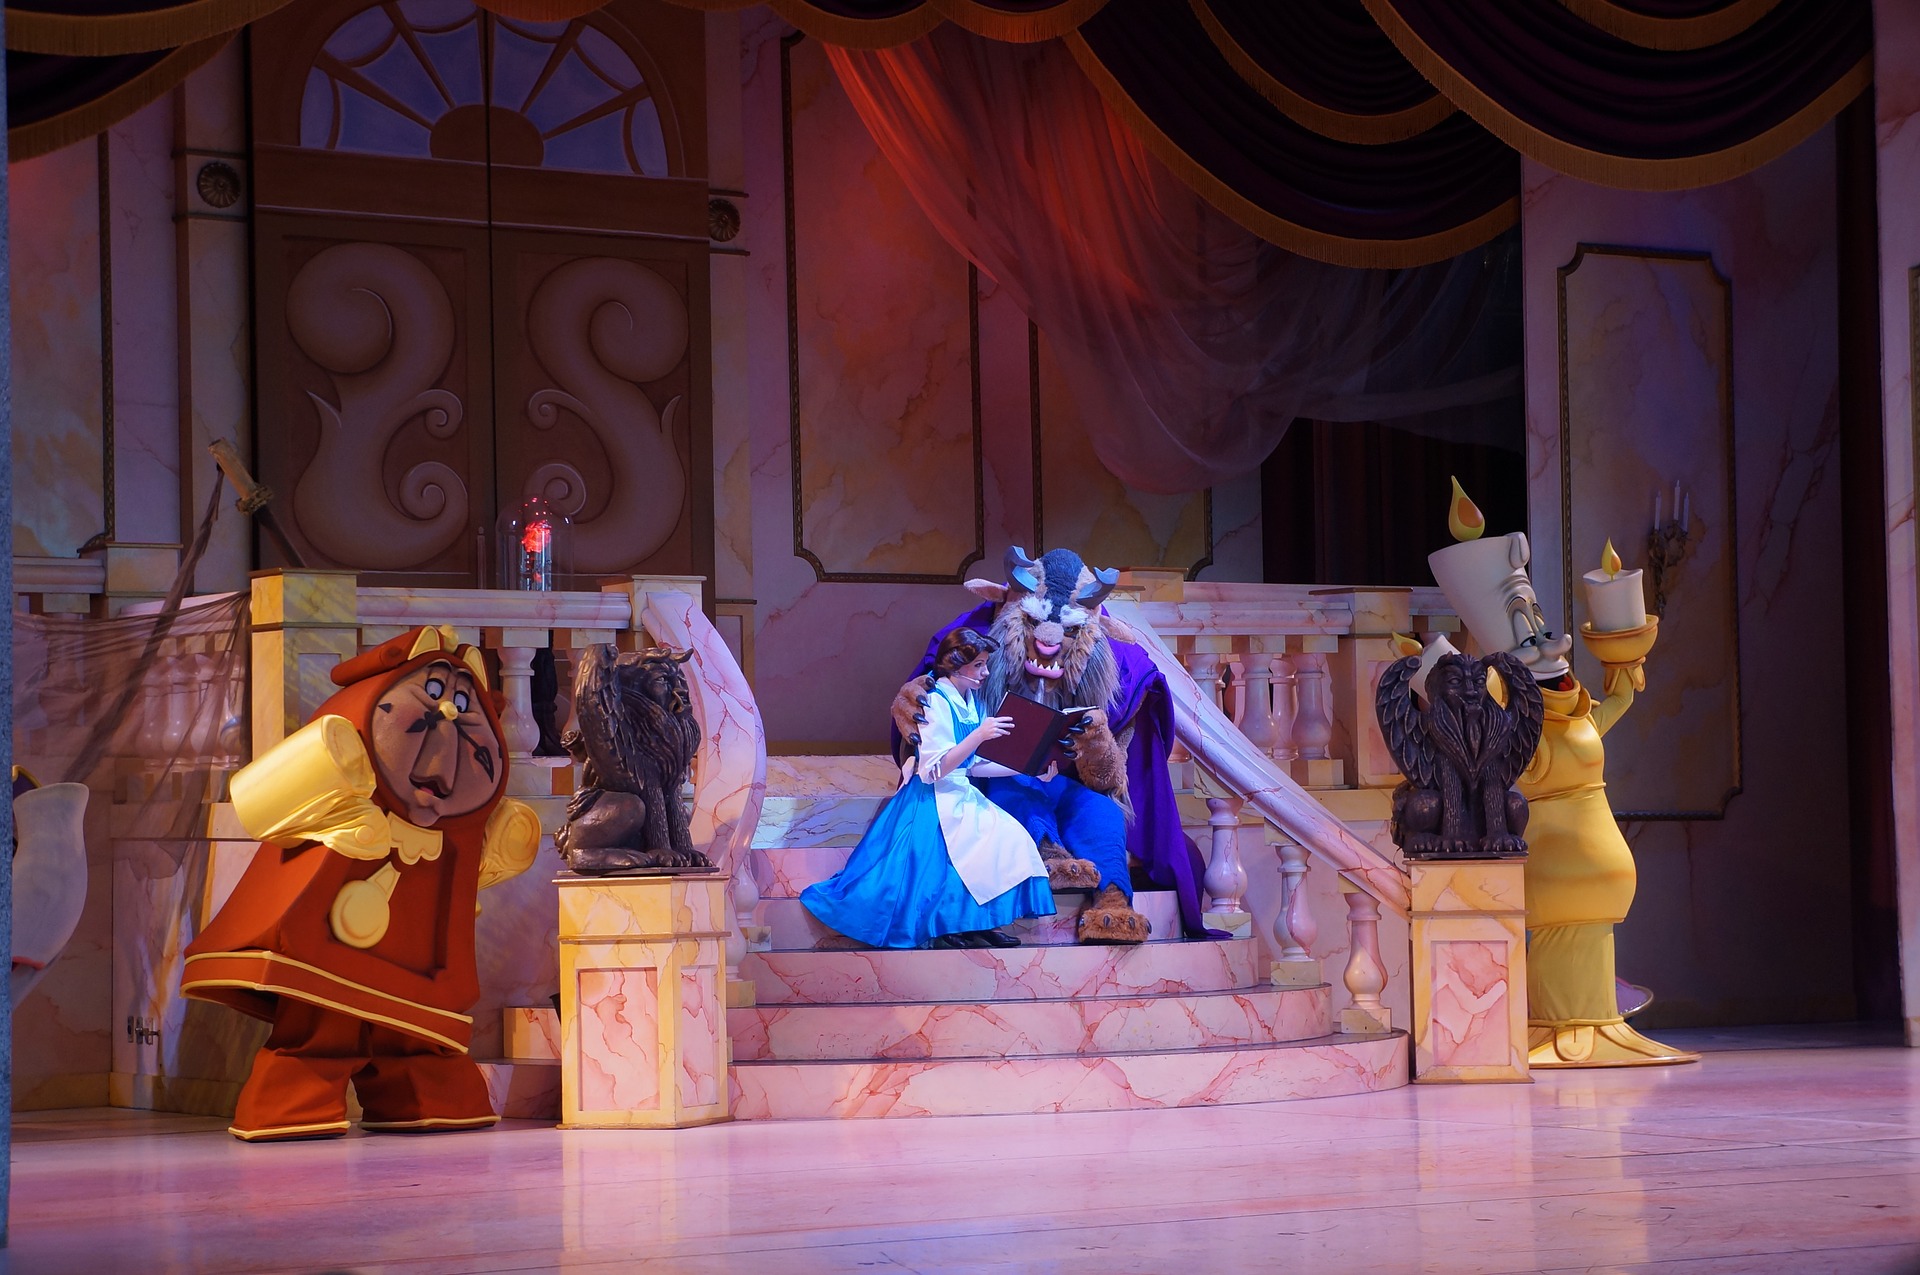
Do you ever wonder whom would’ve Belle chosen, if she was presented with more than two potential romantic partners: Gaston or The Beast? Big Data algorithms make it possible for us to find “The One” online through functions and algorithms that learn our preferences and prompt us with potential matches. Our romance is backed up by statistical discrimination and adverse selection.
The Frog Prince could’ve really needed a dating algorithm as well, then he wouldn’t have ended up with a princess that throws him against a wall – and maybe he could’ve met Belle instead.
Human Capital
Flora, Fauna, and Merryweather were appointed to take care of the Sleeping Beauty and make sure that Aurora never pricks her finger in the spinning wheel – but unfortunately, the fairies got distracted and Aurora did prick her finger. With the use of Big Data, her parents could’ve chosen the best employees for this particular task (from the many working for them in the kingdom) at the right compensation level, through expert use of statistics and modeling. (Davenport, 2012)
Automotive
Although the rest of the fairy tales can be upgraded by the use of Big Data, I must say that Aladdin and the magic carpet is a bit ahead of us because it escaped the long debate on whether self-driving cars need a wheel or not, and it can freely navigate in the environment. Self-driving cars (and the magic carpet) depend on Big Data – “it’s really all about processing Big data, and the road is just another data set to be mined”. (Vanderbilt, 2012)
Construction building
The three little pigs would’ve had a better chance at predicting the risk of the Bad Wolf blowing their little house, with construction process risk analysis. Construction industry highly benefits from the use of Big Data, from analyzing team structure, budget, and schedule, to processing larger sets of data, such as drone footage. (McKinsey, 2017)
In I4L we focus on disseminating academic research through practical ideas and tools for digital leaders.
*I would like to thank my very good friend, Msc. Cand. In Digital Innovation and Management, Sonja Zell, and my good colleague, Assistant Professor of Information Systems, Raffaele Ciriello, for contributing with fairy tales ideas.
Bibliography
- Adomavicius, G., and Tuzhilin, A. 2005. “Toward the Next Generation of Recommender Systems: A Survey of the State-of-the-Art and Possible Extensions,” IEEE Transactions on Knowledge and Data Engineering (17:6), pp. 734-749.
- Chen, H., Chiang, R., & Storey, V. (2012). Business intelligence and analytics: from big data to a big impact. MIS Quarterly, 36(4), 1165–1188.
- Davenport, T. (2006). Competing on analytics. Harvard Business Review
- Reinventing Construction: A route to higher productivity(Rep.). (2017). McKinsey & Company.
- Richter, A., & Wagner, D. (2014). Leadership 2.0: Engaging and Supporting Leaders in the Transition Towards a Networked Organisation. Hawaii International Conference on System Sciences,7
- Singh, A. (2017). Deep Learning will radically change the ways we interact with technology. Harvard Business Review. https://hbr.org/2017/01/deep-learning-will-radically-change-the-ways-we-interact-with-technology
- Vanderbilt, T., (2012). Let the robot drive: the autonomous car of the future is here. Wired. https://www.wired.com/2012/01/ff_autonomouscars/